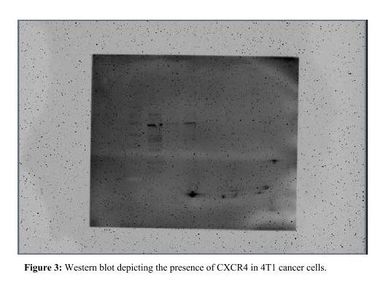
A western blot was ran to demonstrate and clarify the presence of CXCR4. The bands appeared have about 47 kilodaltons, as shown in Figure 3. From the western blot, there are three bands. The band on the right shows early 4T1 cancer cell lysate. The second band depicts the middle stage of the cells lysate. The last band demonstrates the 4T1 cells in its last stage of lysate. Also from the western blot, there was proof that there was the CXCR4 gene.
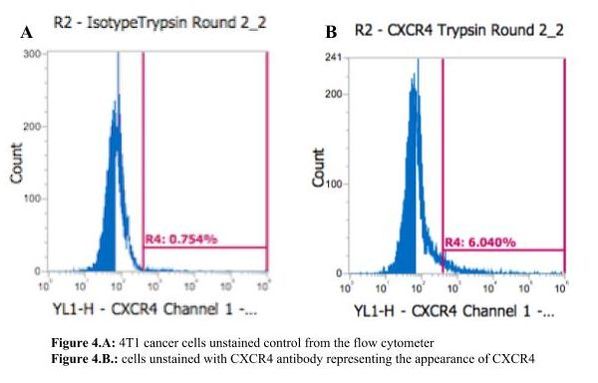
In Figure 4.A and 4.B, the flow cytometer shows different graphs when the cells were unstained and stained. Both of the graphs present that CXCR4 is in the 4T1 cancer cells. The 6% right shift in the graphs show the presence of CXCR4 in channel one when using the CXCR4 antibody conjugated with the PE.
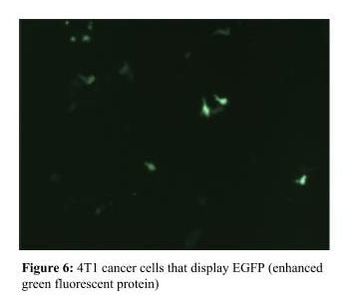
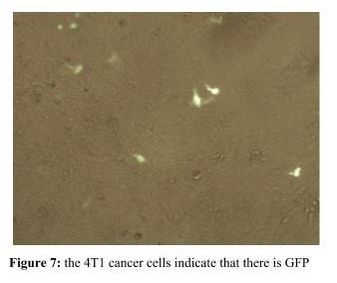
Looking at Figure 6, the 4T1 cancer cells display the enhanced green fluorescent protein, which is why the cells were glowing. In Figure 7, there is an indication that the 4T1 cancer cells have GFP, and that the plasmid was taken into the cells.

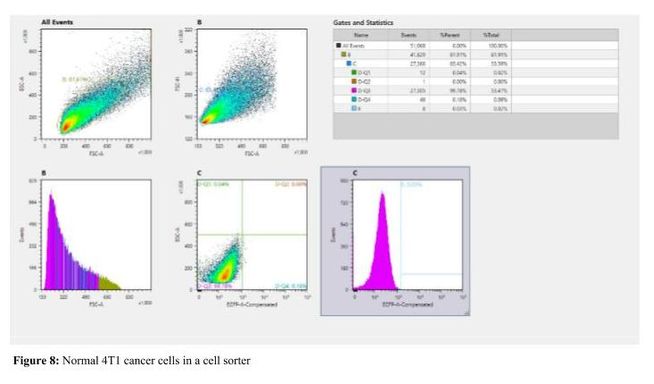
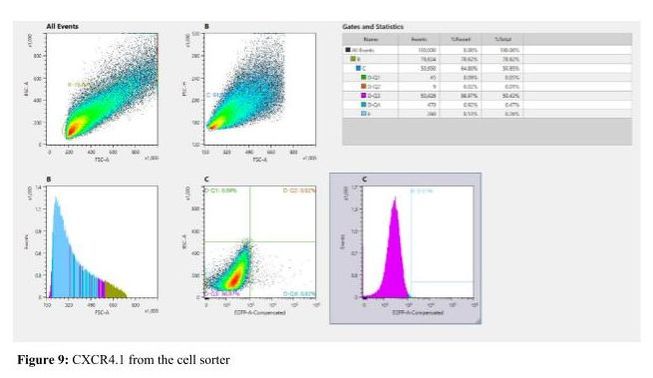
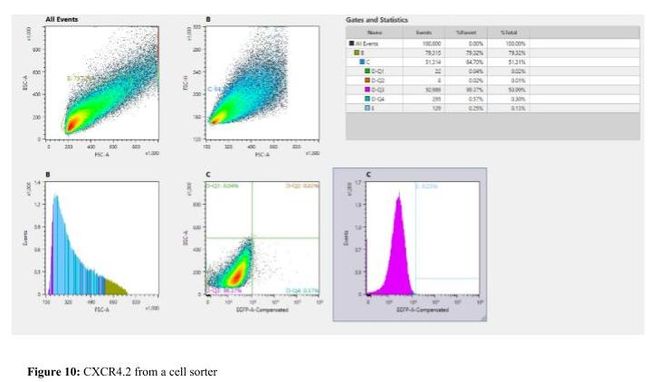
The graphs from Figures 8, 9, and 10 were taken from a cell sorter. In Figure 8, the graphs displays the normal 4T1 cancer cells. In Figure 9, the cells show CXCR4.1, and in Figure 10, it shows CXCR4.2. For all these images, the graph on the top left reveals the total cell population. The second graph depicts cells that are singlets, doublets, and triplets. The last two graphs show how many cells have the GFP and do not. From these graphs, it demonstrates transfection verification.